Funding, Enrollment & Teachers
A thriving public school system requires sufficient funding, robust student enrollment and effective teachers
Student enrollment increased in Fort Bend and Montgomery counties although their per pupil spending continues to lag the state. Teachers across Texas and the Houston three-county region continue to grow more diverse, but teacher turnover rates begin to increase once again. The average base pay for teachers in the Houston region is higher than the state, but public Texas school teacher salaries continue to lag the national average.
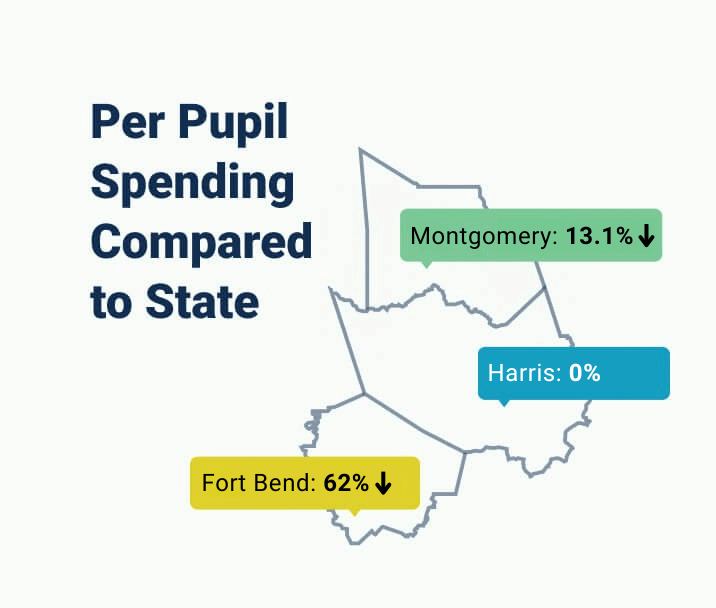
Spending per pupil in Fort Bend and Montgomery counties was lower than the state average in 2022-23
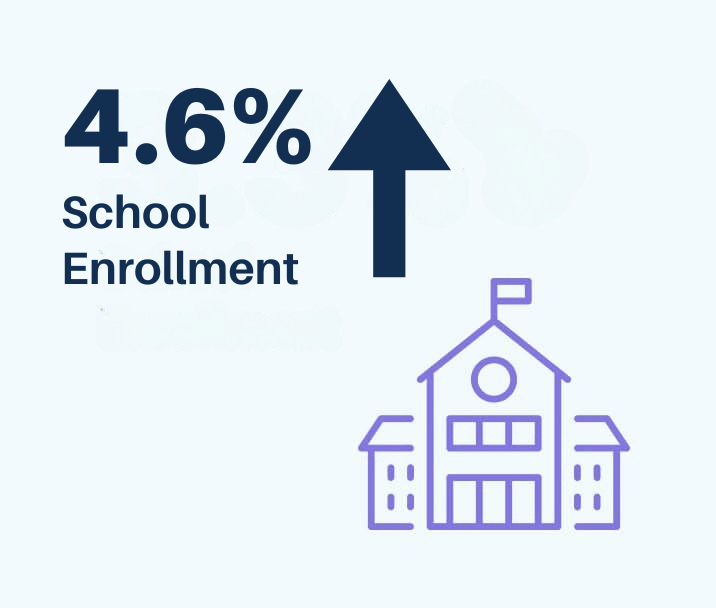
School enrollment in the Houston three-county region increased by 4.6% between 2014-15 and 2023-24, driven primarily by gains in the region’s suburban counties.
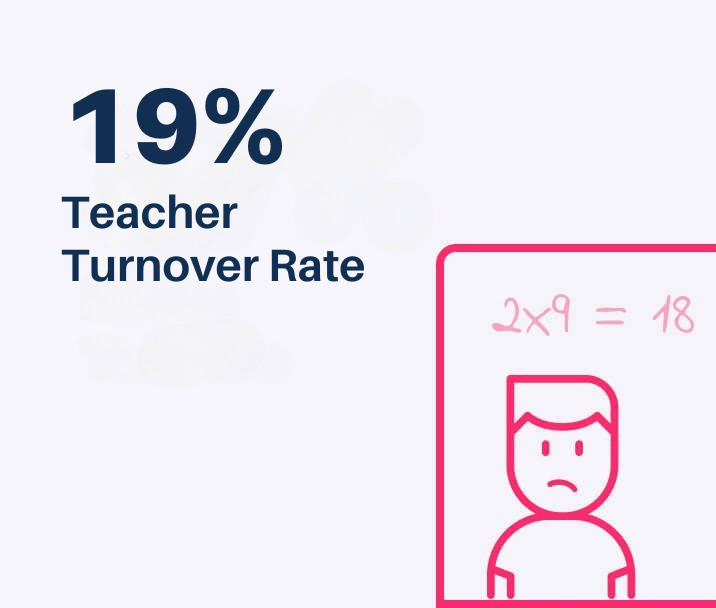
After teacher turnover rates in the region fell between 2018 and 2021, they increased by 4.5 percentage points by 2024.
Why school funding, enrollment, and teachers matter to Houston
Public schools need students, teachers and money. School funding formulas are notoriously complex, but they are still tied to attendance rates derived from student enrollment. The COVID-19 pandemic led to significant declines in student enrollment in Harris County, which led to concerns over future funding. That funding determines how much Houston-area schools can spend on essentials like textbooks, staff, computers and even facility maintenance. Recent research has shown high school graduation rates increase by about seven percentage points for all students — and roughly 10 percentage points for students from low-income families — for every 10% increase in per-pupil spending.1 An analysis of funding gaps in Texas school districts, the difference between funding a district needs vs. what the district receives, found that districts with funding gaps exceeding 40% are strongly associated with a Texas Education Agency student achievement rating of C or lower.
Teachers, of course, are essential to student learning.2 When students are educated by teachers who are supported, well-compensated and experienced, they have better academic outcomes that can persist over time, are more likely to succeed in future academic work, are more likely to graduate from high school,3 and are more likely to enroll in higher education.4 And while teachers were leaving the profession prior to the challenges COVID-19 brought, the teacher shortage has only worsened since then and this trend persists post-pandemic.
When schools, students, and teachers are equipped with the resources they need in order to thrive, the foundation of the entire public school system is strengthened; consequently, so is the future of our region.
The data
School funding is on the rise, but per pupil spending in Houston’s three-county area lags that of the state
How does school funding affect students? Funding is critical for student success. Research has shown high school graduation rates increase by about seven percentage points for all students — and roughly 10 percentage points for students from low-income families — for every 10% increase in per-pupil spending.6
In 2023, the U.S. spent around $16,526 per pupil (costs associated with instruction, student support services, and payroll for public pre-K-12 schools), according to the Census’ Annual Survey of School System Finances.
Where does Texas rank in school funding per child? According to the Census Bureau, average per pupil spending in Texas ($12,304) is well below the national average.7 Among all 50 states and District of Columbia, Texas ranks 42nd on this measure (an improvement from its rank as 44th in 2019).
Furthermore, a 2024 analysis conducted by Houston Education Research Consortium found that 73% of Texas school districts were underfunded during the 2020-21 school year and that a statistically significant relationship exists between district funding gaps and student achievement with districts that have larger funding gaps generally having lower student achievement.
Total Operating Expenditures per Pupil measures the total operating expenditures, divided by the number of students. This measure excludes debt service, construction expenditures, and other capital outlays. It is a key metric as it reflects the level of resources available to support each student’s education.
Operating Expenditures per Student
In 2024 Dollars
Total operating expenditures per student8 in Texas increased about $1,100 (inflation-adjusted) to $12,754 in 2012-23 from $11,653 in 2005-06 in 2024 inflation-adjusted dollars, according to the Texas Education Agency (TEA).
Student enrollment grows in Fort Bend and Montgomery counties but stagnates in Harris County
Enrollment refers to the number of students enrolled in public schools (including charters) from early childhood education (pre-K) through 12th grade as of the last Friday in October.
Enrollment in Texas public schools exceeded 5.5 million students in the 2023-24 school year, an increase of 6% since 2014-15. Since the 1987-88 school year, when the Texas Education Agency began collecting data in its current system, public school enrollment in Texas has increased every year—except for a 2% decline between 2019-20 and 2020-21, an effect of the COVID-19 pandemic.9
Enrollment at Texas Public Schools
Number of students enrolled in Kindergarten through 12th grade at Texas public schools
Across the three-county area, 1.1 million students were enrolled in public schools for the 2023-24 academic year, representing a 5% increase from 2014-15. During this period, enrollment in Harris County stagnated, but Fort Bend and Montgomery counties saw significant growth increasing by 23% and 29%, respectively.
Enrollment by Race/Ethnicity
Public schools in Texas and in Houston’s three-county region serve a diverse population of students — the majority of whom identify as nonwhite, consistent with the racial/ethnic composition of Greater Houston’s population.
Enrolled Students by Race/Ethnicity
Percent of enrolled students by race/ethnicity in 2020-21 academic year
In the 2023-24 school year in Texas, Hispanic students accounted for the largest group of total enrollment (53%), followed by white (25%), Black (13%), Asian-American (5%), and multiracial (3%) students. Among the three local counties, Montgomery has the highest percentage of students who are white (42%), Fort Bend has the highest share of Asian American students (20%), and Harris County has the largest proportion of Hispanic students (56%) making up over half the student population. This reflects the demographic composition of these counties.
Between the 2019-20 and 2023-24 school years, the racial/ethnic composition of students did not change much across the Houston three-county region or Texas with the exception of Montgomery County where the percentage of white students decreased by six points.
Enrollment by Socioeconomic Status
School districts are required to collect and report the socioeconomic status of each student to the Texas Education Agency for purposes of the annual state accountability ratings and for federal reporting. A student who is eligible for free or reduced-price lunch or for other public assistance is classified as “economically disadvantaged.”
Students Economically Disadvantaged
Percent of enrolled students classified as "economically disadvantaged," defined as being eligible for free or reduced-price lunch
In 2023-24, the majority (62%) of students enrolled in Texas public schools were classified as economically disadvantaged. While the share of economically disadvantaged students has grown throughout the three-county area, it remains highest in Harris County at 69%. Harris County’s rate of economically disadvantaged students is higher than the state average (62%), Montgomery County (50%), and Fort Bend County (49%). However, the percentage of economically disadvantaged students has increased slightly faster in Fort Bend (10 points) and Montgomery (9 points) counties compared to Harris County (7 points) between.
Enrollment of Emergent Bilingual Students
Students whose primary language at home is not English and who are not yet proficient in English are classified as emergent bilingual (EB). EBs are a diverse group of students with varying levels of English proficiency. Students classified as EBs are eligible to participate in language assistance programs that help them attain English proficiency and support core academic programs such as English as a second language, dual language, or bilingual programs. Research has shown that participation in enhanced language programs not only helps to improve students’ English language skills, but also helps to improve educational outcomes.10
Emergent Bilingual Students
Percent of enrolled students classified as "Emergent Bilingual" (EB)
The proportion of students classified as EB has grown in our region and across the state since 2014–15. As of the 2023–24 school year, 22% of students in Fort Bend County are classified as EB, 32% in Harris County, 21% in Montgomery County, and 24% across Texas.
Texas replaced the term “English learner” (EL) with emergent bilingual (EB) to emphasize bilingualism as a strength, reflecting research on the cognitive benefits of learning multiple languages. However, the timing of reclassification to English proficient significantly affects student outcomes. Students who reclassify as English proficient in elementary school typically outperform their peers, including those who were never classified as EB. In contrast, students who remain classified as EB through middle or high school face greater academic challenges.
A report from Rice University’s Kinder Institute for Urban Research found a growing share of EB students are not reclassified by the time they enter middle school. Among students who began first grade in 2011–12, nearly half had not been reclassified by the time they began middle school in 2016–17. That rate grew to over 80% for students who started first grade in 2018–19 and entered middle school in 2023–24. This report points to a key change made in 2018 to the Texas English Language Proficiency Assessment—the test for students to be classified as English proficient—particularly the shift from an in-person, teacher-administered exam to an online assessment. In 2017, the year prior to the changes, more than half of students passed the oral portion but that dropped to just 7.6% in 2018.
Enrollment in Special Education
The Individuals with Disabilities Education Act (IDEA) ensures all eligible children with disabilities receive a free appropriate public education. However, students with disabilities in Texas had not been receiving the services, therapies, and education they require because of a 2004 policy set by the Texas Education Agency (TEA) that capped the percentage of students who could receive special education services at 8.5%, denying thousands of students the support they needed. After a 2016 Houston Chronicle investigation, the cap was banned in 2017. Then in 2018, the U.S. Department of Education found Texas had violated federal law by setting this cap and ordered Texas to create a plan to correct the problem.
Despite this, a 2021 follow-up revealed that the TEA had failed to implement the necessary changes to comply with IDEA. As of 2023, the U.S. Department of Education announced that the Texas Education Agency had fulfilled its obligations as outlined in the Individuals with Disabilities Education Act. To ensure continued compliance, the Texas Education Agency conducts annual compliance reviews of local education agencies.
Students with Disabilities
Percent of enrolled students who receive special education services
Recent data from the Texas Education Agency show the percentage of students served in special education programs has increased since the Houston Chronicle investigation came out in 2016, but remains lower than national averages. In 2023-24, the percentage of students enrolled in special education programs was 14% in Fort Bend County and Texas and 13% in Harris and Montgomery counties. While national 2023-24 data is not yet available, in 2022-23 the national rate was 15%, according to the 2023 Digest of Education Statistics.
Between 2014-15 and 2023-24, the percentage of students in special education programs doubled in Fort Bend County and increased by 5 percentage points in Harris and Montgomery counties and Texas overall.
Teacher experience in Harris County has improved but still lags the state, which lags the country
Established research has shown that teachers are the No. 1 predictor of student success inside the classroom.11 They are critical and foundational to delivering a high-quality education. Students who have consistent access to excellent teachers have better academic outcomes, are more likely to succeed in future academic work, are more likely to graduate from high school,12 and are more likely to enroll in higher education.13
Teacher Experience
Similar to professionals in other occupations, as teachers gain experience, they become more effective. As teachers have time to master their craft, their students show academic gains. These gains are more pronounced in the first decade of teaching, but extend through the second and third decade as well, and their students also have better attendance and score higher on standardized tests (one measure of learning).14
Nationally, American teachers had an average of 14.5 years of teaching experience in 2020-21 (most recent data available), well below the 11.2-year average among teachers in Texas for the same year, which suggests teachers in Texas are more likely to leave their profession earlier.
Average Years of Teacher Experience
Average years of teacher experience
Across the state, average teacher experience did not improve much between 2017-18 (10.9 years) and 2023-24 (11.1 years). While the average years of teaching experience in Harris County remains below the state average, it increased almost a full year between 2018 and 2024 while the average decreased by half a year in Montgomery County during the same time.
Novice Teachers
Percent of teachers with five or fewer years of experience
Across all three counties and the state, the percent of teachers with five or fewer years of experience slightly decreased between 2017-18 and 2020-21 but then increased as of the 2023-24 school year. More than a third of teachers (36 %) across the state have five or fewer years of experience, with similar percentages across the three-county area. This is more or less the same as the 2018 share of 37%. Among Houston’s three-county region, students in Harris County are more likely to be educated by new teachers than those in Fort Bend or Montgomery counties. Given the size of Harris County, this pushes the overall average for the three-county region above that of the state.
Research also shows that Black and Latino students are most likely to be in classrooms with teachers who are in their first year of teaching or their first five years of teaching (known as “novice teachers”). The Education Trust finds that about 34% of Black students and 17% of Latino15 students in Texas attend schools with high percentages (i.e., greater than or equal to 20%) of novice teachers.
Teacher Demographics
Students are also less likely to be taught by teachers of color. This is important because being taught by a diverse teacher workforce has benefits for all students, not just those of color, but the benefits tend to be more pronounced for students of color. Students who are taught by a diverse workforce show better academic outcomes, lower suspension rates, and higher graduation rates.16
Teacher Demographics
Percent of teachers by race/ethnicity
Compared to the racial/ethnic makeup of the student body, the teacher workforce in the Texas public school system is far less diverse. While the majority of teachers in Texas are white, diversity is slowly increasing. Between the 2012-13 and the 2023-24 school years, the percentage of white teachers declined from 63% to 53%, while the share of Hispanic teachers increased by 5 percentage points to 30%, and the share of Black teachers increased about three points to 13% in 2023-24. The proportion of teachers in Texas who are Black now match the proportion of students. However, the proportion of white teachers (53%) is still higher than the proportion of white students (25%) and the proportion of Hispanic teachers (30%) is still lower than the proportion of Hispanic students (53%).
Mirroring larger trends in Greater Houston’s diversity, the teacher workforce in Fort Bend and Harris counties is much more diverse than in Montgomery County and the state. Harris County’s teacher workforce was the most diverse in the 2023-24 school year, with 41% of teachers being white and about a quarter of teachers being Black or Hispanic. In Fort Bend County, during the 2023-24 school year, 44% of teachers were white, 29% were Black, and 19% Hispanic. In Montgomery County nearly three quarters of teachers were white although this rate has decreased by 12 points to 73%. Throughout the three-county area, the percentage of Black teachers is twice the 11% state average.
Supporting Teachers
In order for teachers to gain the experience to become more effective, they need support to remain in the profession. Over the past few years, teacher shortages have been a growing concern as educators leave the profession.17 National estimates prior to the pandemic show that between 19% and 30% of new teachers leave the profession within the first five years.18 Attrition rates in urban-area and high-poverty schools are higher than average.19 And this trend appears to be continuing with estimates that across the U.S. in 2024 about 1 in 8 teaching positions were either unfilled or filled by teachers not fully certified for their roles. Teacher turnover rates can provide an indication of the challenges school districts face to replace teachers who may have left the profession or gone to another school district or private schools.
Teacher Turnover
Percent of teachers from previous fall who are not employed in the district for the current fall
The teacher turnover rate in Houston’s three-county region and in Texas overall improved between 2018 and 2021, but by 2024, it had risen above 2018 levels. Across Fort Bend, Harris, and Montgomery counties the turnover rate is the same at about 19%. The trends seen in turnover rates across the three-county region match what has occurred at the state level where in 2024 the teacher turnover rate was also 19%.
Many reasons have been given for this trend,20 including the teacher “pay penalty” which shows that public school teachers earn 27% less in weekly wages than nonteacher college graduates—significantly higher than in 1996 when school teachers were earning 6% less than their similarly educated peers not in the teaching profession. Other research shows the gap widens as teachers remain in the profession.21 Teacher shortages are largely driven by attrition, with an estimated 90% of vacancies every year being due to teachers leaving the profession. This indicates that increased efforts in teacher retention could help combat workforce shortages. Texas House Bill 2, passed in 2025, allocates an additional $8.5 billion in funding for public schools with estimates that about half will go towards teacher and staff pay and retention.
The Texas Education Agency determines minimum salary schedules for public school teachers statewide. For the 2025-26 school year, the minimum salaries for teachers across Texas ranged from $33,960 for first-year teachers to $55,030 for teachers with 20 or more years of experience. After factoring in education and experience, Texas public school teachers earned 24% less in weekly wages than similar college graduates in 2023—lower than the national average of 26.6%
Teacher Salaries
Average salaries of public school teachers
Controlling for inflation, it is estimated that the average Texas public school teacher salary decreased by 9% from 2009-10 to 2023-24. In 2022-23 the average salary of a public school teacher was $60,716 in Texas and continues to lag the national average of $69,597.
Average Base Pay for Teachers
Average base pay for teachers, 2024-25
Within Houston’s three-county area, the average base salary is about 7% higher than the state average. Fort Bend County offered the region’s highest average base pay during the 2024-25 school year at $69,674per year. Harris County’s average base pay for teachers is nearly on par with Fort Bend County’s at $68,728 with Montgomery County slightly lagging at $65,140.
Stress is also a contributing factor teachers cite for leaving the profession.22 The 2024 State of the American Teacher Survey from RAND Corporation found that about twice as many teachers reported experiencing frequent job-related stress or burnout compared with comparable working adults. One of the main factors for beginning teachers to leave within the first year is lack of adequate support from school administration, including training.23 In fact, new teachers who receive little preparation and training are two and a half times more likely to leave after one year.24 A 2025 Gallup poll found that teachers are more likely to be satisfied with their workplace if they also report that they have “the opportunity to do what I do best every day,” “satisfaction with workload,” and “satisfaction with level of pay.” While smaller class sizes can increase student performance, they also affect teacher stress.
Student Teacher Ratio
Ratio of students to teachers
The ratio of students to teachers in Houston’s three-county area decreased slightly between 2021 and 2024 while it increased slightly across the state. The National Center for Education Statistics shows the national average of 15.4 in fall 2022 (the most recent available), at which point the ratio in Texas was 14.8. While this ratio has slightly decreased in Harris and Montgomery counties it increased in Fort Bend County from 15.4 students for every teacher in 2021 to 16.2 students for every teacher in 2024. Within the three-county area, student-teacher ratios vary among school districts. In Montgomery County, Willis ISD has the highest student-teacher ratio at 17.3, while Splendora ISD has the lowest at 14.9. In Harris County, the lowest student-teacher ratio is in Pasadena ISD at 13.1 and the highest in Crosby ISD at 17.1. In Fort Bend County, the student-teacher ratio is higher in Fort Bend ISD at 16.4 compared to Needville ISD at 14.4.
Continue reading about education in Houston on our educational attainment, academic outcomes and post-secondary education pages
Helpful Articles by Understanding Houston:
- Ending the Inertia of Student Mobility in Houston
- COVID-19’s Ongoing Effect on Students in Greater Houston
- Caring for Teachers is Caring for Students
- The Costliest Problem We Know How to Fix
- Using Science and Evidence To Drive Investments in Early Childhood
References:
- C. Kirabo Jackson & Rucker C. Johnson & Claudia Persico. (2015). “The Effects of School Spending on Educational and Economic Outcomes: Evidence from School Finance Reforms,” NBER Working Papers 20847, National Bureau of Economic Research, Inc.https://ideas.repec.org/p/nbr/nberwo/20847.html
- Chetty, Raj, John N. Friedman, and Jonah E. Rockoff, (May 2014). “Measuring the Impacts of Teachers II: Teacher Value-Added and Student Outcomes in Adulthood,” American Economic Review, 104(9) 2633–2679.
- Jackson, C. Kirabo. (October 2018) “What Do Test Scores Miss? The Importance of Teacher Effects on Non–Test Score Outcomes.” Journal of Political Economy, 126(5), 2072–2107. https://doi.org/10.1086/699018
- Chetty, Raj, John N. Friedman, and Jonah E. Rockoff, (May 2014).
- Baker, B. D. (2017). How money matters for schools. Palo Alto, CA: Learning Policy Institute.https://learningpolicyinstitute.org/product/how-money-matters-report
- C. Kirabo Jackson & Rucker C. Johnson & Claudia Persico. (2015).
- This is true even after factoring in cost of living differences. Generally speaking, the cost of living in Texas is about 92% to 95% of the national average. Essentially, when student funding in Texas is increased by 5-8%, the result is still below the national average of $13,187.
- This includes all expenditures made for the operations of the school district. Expenditures for debt service and capital outlay are excluded.
- Texas Education Agency. (2021). Enrollment in Texas public schools, 2020-21. (Document No. GE21 601 08). Austin, TX. Retrieved from https://tea.texas.gov/sites/default/files/enroll-2020-21.pdf
- Genesee, Fred, Kathryn Lindholm-Leary, William Saunders, and Donna Christian. (2005) “English language learners in US schools: An overview of research findings.” Journal of Education for Students Placed at Risk, 10( 4), 363-385.https://www.tandfonline.com/doi/abs/10.1207/s15327671espr1004_2
- Chetty, Raj, John N. Friedman, and Jonah E. Rockoff, (May 2014).
- Jackson, C. Kirabo. (October 2018).
- Chetty, Raj, John N. Friedman, and Jonah E. Rockoff, (May 2014).
- Kini, T., & Podolsky, A. (2016) Does Teaching Experience Increase Teacher Effectiveness? A Review of the Research. Palo Alto: Learning Policy Institute.). Retrieved from https://learningpolicyinstitute.org/our-work/publications-resources/does-teaching-experience-increase-teacher-effectiveness-review-research
- The Education Trust (2022). Educator Diversity State Profile: Texas. Retrieved from https://edtrust.org/rti/educator-diversity-state-profile-texas/
- Forthcoming Handbook of Research on Teachers of Color and Indigenous Teachers. Retrieved from https://uh.edu/education/research-convening/
- Sutcher, Leib, Linda Darling-Hammond, and Desiree Carver-Thomas. (2016) “A Coming Crisis in Teaching? Teacher Supply, Demand, and Shortages in the US.” Learning Policy Institute, pp. 499-534. https://learningpolicyinstitute.org/sites/default/files/product-files/A_Coming_Crisis_in_Teaching_REPORT.pdf
- Podolsky, A., Kini, T., Bishop, J., & Darling-Hammond, L. (2016). Solving the teacher shortage: How to attract and retain excellent educators. Learning Policy Institute. Retrieved from https://learningpolicyinstitute.org/product/solving-teacher-shortage
- Sutcher, L., Darling-Hammond, L., & Carver-Thomas, D. (2016).
- Podolsky, A., Kini, T., Bishop, J., & Darling-Hammond, L. (2016).
- Ibid
- Carver-Thomas, D., & Darling-Hammond, L. (2017). Teacher turnover: Why it matters and what we can do about it. Learning Policy Institute. Retrieved from https://learningpolicyinstitute.org/product/teacher-turnover-report
- Ingersoll, R. (2003). Is There Really a Teacher Shortage?. Retrieved from https://repository.upenn.edu/gse_pubs/133
- Podolsky, A., Kini, T., Bishop, J., & Darling-Hammond, L. (2016).